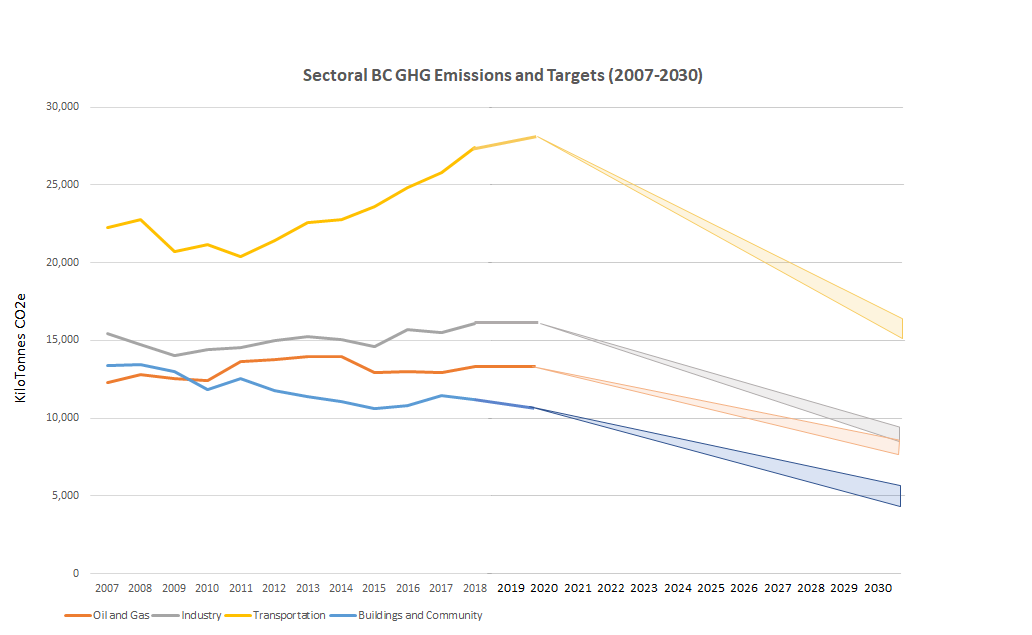
On 26 March 2021 the BC Government unveiled “sectoral targets” – a range of emissions reductions that different sectors of the BC Economy will (if all goes according to plan) meet by 2030. These are not binding on the individual sectors, but will guide government planning and progress reporting as we move towards the Province’s 2030 goal to reduce overall greenhouse gas emissions compared to 2007 levels by 40% by 2030.
BC’s GHG Emissions
BC’s GHG Emissions in 2007 (base year) – 63.4 MegaTonnes of Carbon Dioxide Equivalent
BC’s repealed 2020 emissions target (33% reductions) – 42.5 MT
BC’s 2030 missions target (40% reductions) – 38 MT
Annual damage caused by promised 2030 emissions levels - $2.1 billion
BC’s 2018 GHG emissions (most recent data) – 67.9 MT
Annual damage caused by 2018 emissions levels - $2.9 billion
BC’s net-change since 2007 - +4.5 MT (+7%)
Oil and gas and LNG Canada Emissions
BC’s Oil and Gas Industry Emissions in 2007 – 12.3 MT
2030 sectoral target for the Oil and Gas Industry (33-38% reductions) – Between 7.6 and 8.2 MT
2018 GHG emissions (Oil and Gas Sector) – 13.3 MT (+8.4% since 2007)
New emissions expected from Phase I of LNG Canada – 4 MT
New emissions expected from Phase I and II of LNG Canada in 2030 – 8.6 MT
Promise from Premier John Horgan “[LNG Canada] has to fit within the plan. … [I]t has to meet our test. And our test is reducing emissions by 2030 and then by 2040 and 80 per cent by 2050.”
BC’s Industrial Targets
BC Industrial Emissions in 2007 – 15.5 MT
2030 sectoral target for industry (38-43% reductions) – Between 8.8 and 9.6 MT
2018 GHG emissions (Industry) – 16 MT (+3.8% since 2007)
2018 GHG emissions (Metal Production) – 0.77 MT (-35% since 2007)
2018 GHG emissions (Production/ Consumption of Halocarbons, SF6, and NF34) -1.6 MT (+117% since 2007)
Does it make sense for all “industry” (except Oil and Gas) to be lumped together?
BC’s Transportation Targets
BC Transportation emissions in 2007 – 22.3 MT
2030 sectoral target for Transport (27-32% reductions) – Between 15.1 and 16.3 MT
2018 GHG emissions (Transportation) – 27.4 MT (+23% since 2007)
#SUVFail
BC’s Buildings and Community “Sector”
BC Building and Community emissions in 2007 – 13.4 MT
2030 sectoral target (59-64% reductions) – Between 4.8 and 5.5 MT
2018 GHG emissions (Buildings) – 11.1 MT (-16.5% since 2007)
Ramp up the good work!
Lessons
1. Sectoral targets can be an important tool in planning for the low carbon economy of tomorrow.
2. Don’t lump many different industries that are on different climate paths together.
3. Be honest about what BC (and the oil and gas industry) can and cannot build (and the auto industry can sell) if we’re going to achieve our sectoral targets.

Notes: In order to make the above calculations, we made assumptions about what parts of BC’s emissions inventory would be counted towards each sector. (For example, we included pipeline transportation under oil and gas instead of transportation). The BC government may ultimately make different choices about which sector will be responsible for which emissions.
Annual damage estimates based on the Canadian Government’s Social Cost of Carbon. The Canadian government has recently said that these calculations are likely too low, and need to be revised.